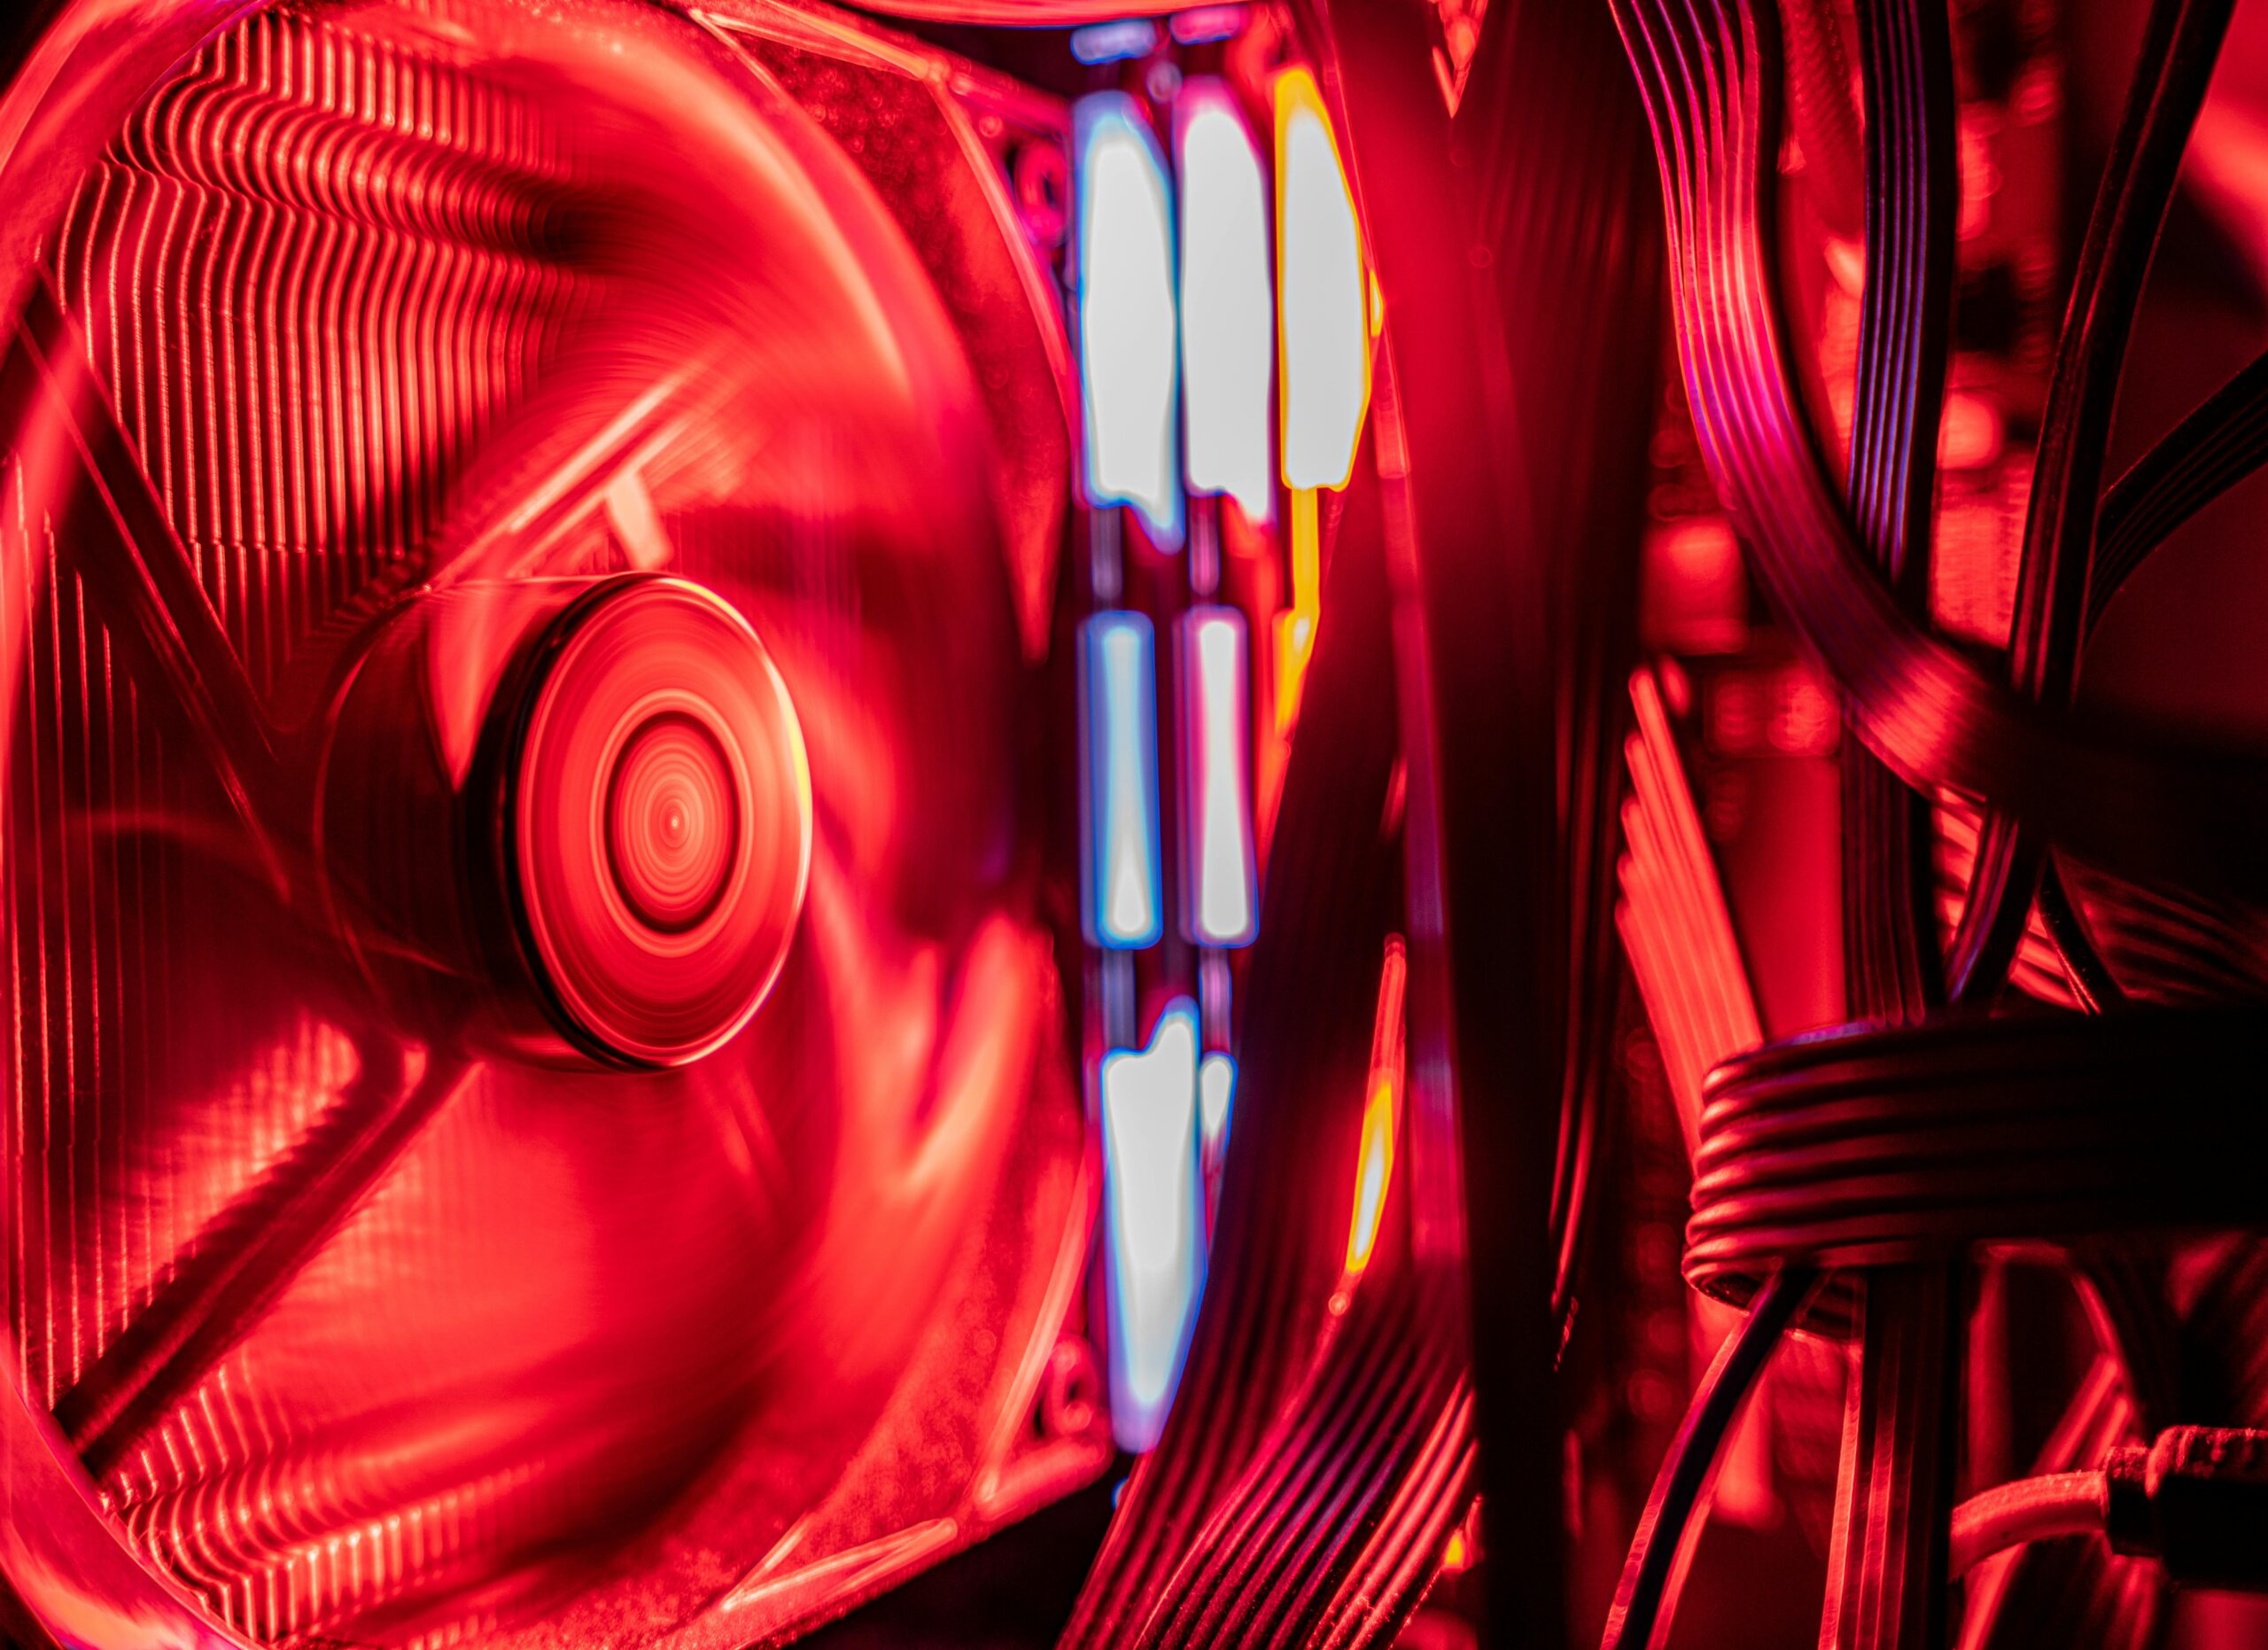
Monitoring your PC’s temperature is essential to prevent overheating, ensure optimal performance, and extend the lifespan of your hardware. High temperatures can lead to performance issues, unexpected shutdowns, or even permanent damage. In this guide, we’ll explore different ways to measure your PC’s temperature on Windows and macOS.
Why Should You Monitor Your PC’s Temperature?
Keeping an eye on your computer’s temperature can help you:
- Prevent overheating that can damage components like the CPU and GPU.
- Optimize performance by ensuring your cooling system is working properly.
- Identify hardware issues such as failing fans or clogged heat sinks.
- Enhance system longevity by reducing thermal stress on components.
How to Check Your PC’s Temperature on Windows
1. Using BIOS/UEFI
Most motherboards have built-in temperature monitoring tools accessible through the BIOS or UEFI.
Steps:
- Restart your PC.
- During boot-up, press the appropriate key to enter BIOS/UEFI (usually Delete, F2, or F10, depending on the manufacturer).
- Look for a section like Hardware Monitor, PC Health Status, or System Monitor to find temperature readings for the CPU and other components.
Note: BIOS/UEFI only provides real-time temperature readings and doesn’t show temperatures under full load.
2. Using Third-Party Software
To monitor your PC’s temperature in real-time, use third-party applications:
- HWMonitor – Displays CPU, GPU, and motherboard temperatures.
- Core Temp – Focuses on CPU temperature with per-core readings.
- Speccy – Provides a detailed overview of hardware, including temperatures.
- MSI Afterburner – Great for monitoring GPU temperature, especially for gaming.
Steps:
- Download and install the chosen software.
- Open the application and check temperature readings for CPU, GPU, and other components.
- Monitor fluctuations while performing tasks like gaming or video editing.
3. Using Windows Task Manager (Limited Functionality)
Windows 10 and 11 Task Manager do not provide temperature readings, but some gaming laptops and PCs with special software (e.g., Alienware Command Center) may show temperature statistics.
How to Check Your Mac’s Temperature
macOS does not provide built-in tools to check temperature, but third-party apps can help:
- iStat Menus – A powerful monitoring tool for CPU, GPU, and fan speeds.
- Macs Fan Control – Allows both monitoring and fan speed adjustment.
- Intel Power Gadget – Ideal for Intel-based Macs to track CPU temperature.
Steps:
- Install your preferred software.
- Open the app and check temperature readings.
- Monitor fluctuations based on system workload.
Optimal Temperature Ranges
| Component | Idle Temperature | Under Load |
|---|---|---|
| CPU | 30-50°C | 60-85°C |
| GPU | 30-45°C | 65-85°C |
| Hard Drive/SSD | 25-40°C | 45-60°C |
| Motherboard | 30-50°C | 60-80°C |
Warning: If your temperatures exceed these ranges consistently, consider improving your cooling system.
Tips to Lower PC Temperature
- Clean dust from fans and vents regularly.
- Improve airflow by adding case fans or rearranging components.
- Apply fresh thermal paste on the CPU/GPU if overheating persists.
- Use a cooling pad for laptops.
- Avoid running intensive programs in high ambient temperatures.
Monitoring your PC’s temperature is crucial for maintaining system health and performance. Whether you use built-in BIOS tools or third-party software, keeping an eye on temperatures can help prevent overheating and extend hardware lifespan. If you notice consistently high temperatures, consider optimizing your cooling system to avoid potential damage.
Photo by Dave Morgan


